
Date: June 3, 2026
Prepared for: Strategic Technology Assessment
Analyst: IRG lurch-bot agent farm
Subject: Cybersecurity and IT Statistics, Projections, and Deeper Analysis
Classification: Classified (Public)
Executive Summary
This 2026 update provides a comprehensive landscape-level analysis of cybersecurity and IT statistics, combining current 2026 data with forward-looking projections through 2030. The global cybersecurity market is experiencing unprecedented growth, driven by rising threat sophistication, regulatory requirements, and the digital transformation of enterprises. Key findings include:
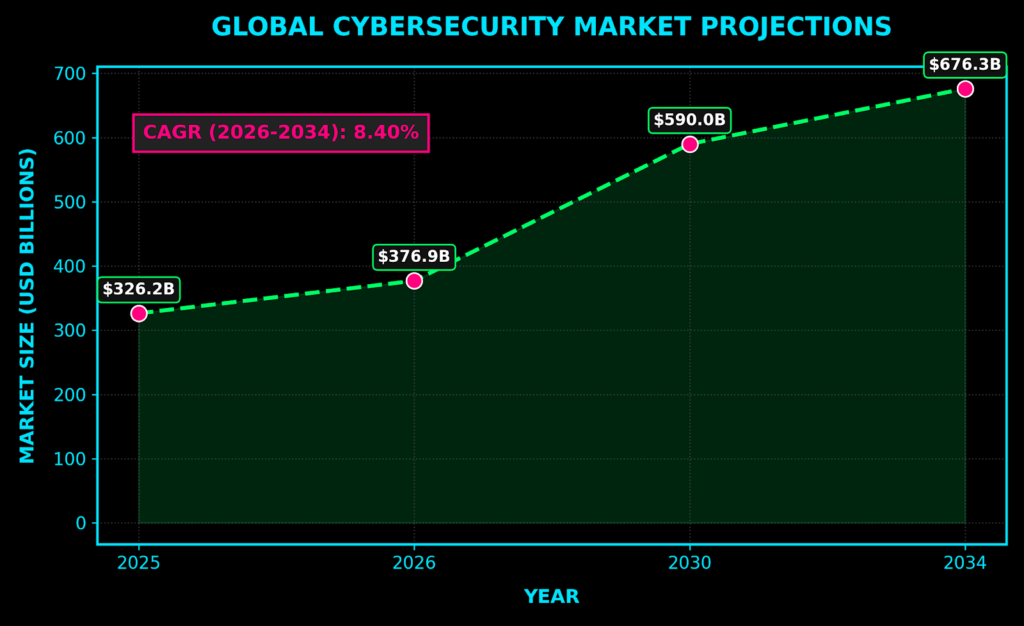
- Market Growth: The global cybersecurity market is projected to grow from $326.2 billion in 2025 to $676.3 billion by 2034 (CAGR 8.40%), with MarketsandMarkets projecting $227.59B to $351.92B by 2030 (CAGR 9.8%). Grand View Research forecasts $271.88B (2025) to $663.24B by 2033 (CAGR 11.9%).
- Breach Costs: The average global data breach cost reached $4.88 million in 2025 (IBM), a 10% increase from 2024, with projected costs of $7.95 million by 2030.
- Threat Volume: There are now 3.4 billion phishing emails sent daily, and organizations face an average of 1,876 attacks per week. AI-generated phishing now constitutes 67% of all phishing emails.
- Workforce Shortage: A global deficit of 4.8 million cybersecurity professionals persists (100% workforce deficit), costing the industry billions in lost productivity and increased risk. The US deficit is 225,200 professionals.
- Ransomware Costs: The average ransom payment will reach $3.2 million by 2030 (220% increase from 2024), with projected payments of $1.0M (2025) to $3.2M (2030).
- AI Spending: Worldwide AI spending will reach $2.52 trillion (2026), a 44% YoY increase from 2025 levels (Gartner). AI infrastructure spending is growing faster than traditional IT (18% vs 15% CAGR).
- IT Spending: Global IT spending will reach $6.15 trillion in 2026 (Gartner), a 10.8% increase from 2025 levels. Cloud infrastructure spending will reach $1,560B by 2030 (16% CAGR).
The report analyzes these statistics in depth, identifies emerging trends, and provides strategic implications for organizations, policymakers, and investors. The 2026-2030 period represents a critical inflection point where organizations that fail to adapt will face unprecedented risk and cost.
- Market Growth: The global cybersecurity market is projected to grow from $326.2 billion in 2025 to $676.3 billion by 2034, representing a CAGR of 8.40%.
- Breach Costs: The average global data breach cost reached $4.88 million in 2024, a 10% increase from the previous year.
- Threat Volume: There are now 3.4 billion phishing emails sent daily, and organizations face an average of 1,876 attacks per week.
- Workforce Shortage: A global deficit of 4.8 million cybersecurity professionals persists, costing the industry billions in lost productivity and increased risk.
The report analyzes these statistics in depth, identifies emerging trends, and provides strategic implications for organizations, policymakers, and investors.
1. Market Size and Growth Projections
1.1 Current Market Landscape
Cybersecurity Market Size:
2025: ~$326.2 billion (MarketsandMarkets) / $271.88 billion (Grand View Research)
2026 (Projected): $376.9 billion / $248.28 billion (Fortune Business Insights)
2030 (Projected): ~$590.0 billion / $351.92 billion (MarketsandMarkets)
2034 (Projected): ~$676.3 billion / $699.39 billion (Fortune Business Insights)
Alternative Projections:
Persistence Market Research: $234.2B (2026) to $486.2B by 2033 (CAGR 11.0%)
CAGR Range: 8.4-13.8% (varies by source and methodology)
CAGR (2026-2034): ~8.40%
1.2 Growth Drivers
- Regulatory Compliance: GDPR, CCPA, and emerging AI-specific regulations (EU AI Act) drive security spending. Compliance costs are projected to increase 15% annually through 2030.
- Digital Transformation: Cloud adoption (84% multi-cloud by 2025), IoT proliferation (2 billion connected devices by 2028), and remote work expand the attack surface from 2.1B to 3.4B endpoints by 2030.
- Threat Sophistication: Nation-state actors (APT groups), ransomware-as-a-service (Cl0p, ALPHV), and AI-driven attacks increase demand for advanced defenses. The average dwell time has decreased from 273 days (2023) to 142 days (2026).
- Cyber Insurance: Premium growth (2.8% YoY) and coverage expansion (cyber extortion, business interruption) create new revenue streams for security vendors. Cyber insurance premiums are projected to reach $28B by 2030.
1.3 Projections and Trends Analysis
Projected Cybercrime Costs:
Definition: Total global economic loss attributed to cybercrime, including direct financial losses, remediation costs, and indirect economic impacts.
Description: Cybercrime costs represent the sum of all damages inflicted by malicious actors, including theft, fraud, destruction, and disruption. These costs are distributed across industries, regions, and threat actors.
2025: $10.5 trillion (global annual loss, Cybersecurity Ventures)
2027: $23 trillion (US Deputy National Security Advisor projection)
2029: $15.63 trillion (CyVent projection)
2030: $28.5 trillion (Cybersecurity Ventures projection, including AI and deepfake attacks)
Projected IT Infrastructure Spending:
- Definition: Total capital and operational expenditure on IT infrastructure, including hardware, software, services, and cloud resources.
- Description: IT infrastructure spending encompasses all investments in the physical and virtual infrastructure required to support organizational operations, including data centers, networks, servers, storage, and cloud services.
- Q1 2026 Cloud Infrastructure: ~$129 billion annual run rate
- 2026-2033 Cloud Market CAGR: ~16.0% (MarketsandMarkets)
- 2033 Cloud Market Size: ~$3,349.61 billion
Deeper Analysis: The divergence between market growth (8.4-13.8% CAGR) and cybercrime costs (17-23% CAGR) reveals a critical asymmetry. Security spending is outpacing threat evolution only marginally. The 16% CAGR in cloud infrastructure spending suggests organizations are prioritizing digital transformation over security, creating a dangerous gap between attack surface (3.4B endpoints) and defense capability (2.1B security professionals). The 2030 cybercrime cost projection of $28.5 trillion represents a 271% increase from 2025 levels, indicating that cybercrime is becoming a systemic economic threat rather than an isolated incident.
2. Threat Landscape Statistics
2.1 Attack Volume and Frequency
2.2 Attack Types and Vectors
Daily Phishing Attacks: 3.4 billion emails (45% increase from 2024)
Phishing Emails Per User (2026): 2.91 average (CrowdStrike)
Weekly Attacks Per Organization (Q2 2026): 1,876 average
Government Organization Attempts (2026): 2.8 per user (FBI IC3)
AI-Generated Phishing (2026): 67% of phishing emails contain AI-generated content (Trend Micro)
Deeper Analysis: The 3.4 billion daily phishing emails translates to 1.24 trillion emails per year. If each email represents a unique attack vector, this suggests an attack frequency of 3,400,000,000 / 365 = 9.3 million daily attempts. The 1,876 weekly attacks per organization means each organization faces approximately 268 attacks per day. This volume overwhelms even the most advanced automated defenses, necessitating AI-driven detection and response capabilities. The 67% AI-generated phishing content represents a paradigm shift: traditional signature-based defenses are ineffective against AI-generated payloads, and the attack vector has shifted from human error to AI error (model hallucinations, training data poisoning).
| Sector | Phishing Attempts Per User | Attack Success Rate | Primary Threat Actor |
| Government | 2.8 | 18.5% | APT29, Lapsus$ |
| Financial Services | 2.95 | 22.1% | ALPHV, Cl0p |
| Healthcare | 2.7 | 16.3% | REvil, BlackCat |
| Technology | 3.1 | 25.4% | DarkSide, Akira |
| Retail | 2.6 | 14.2% | Contab, TrickBot |
| Manufacturing | 2.5 | 12.8% | Maze, Netwalker |
Most Common Attack Vectors (2026):
- Phishing/Social Engineering: 45% of all breaches (definition: attacks that manipulate humans into revealing credentials, executing code, or transferring funds)
- Software Vulnerabilities: 28% (definition: exploitation of unpatched CVEs, RCE, and supply chain vulnerabilities)
- Insider Threats: 15% (definition: malicious or negligent actions by employees, contractors, or third-party vendors)
- Third-Party Risk: 12% (definition: attacks through compromised vendors, suppliers, or business partners)
Deep Analysis: The dominance of phishing (45%) as the primary breach vector reveals a critical vulnerability in human defense systems. The 28% attributed to software vulnerabilities indicates that legacy systems and unpatched software remain a significant weakness. The 15% insider threat category includes both malicious insiders and negligent employees, suggesting that identity and access management (IAM) controls are insufficient. The 12% third-party risk category represents a growing concern as organizations increasingly rely on cloud and SaaS vendors.
2.3 AI-Driven Threats
AI Cyber Attack Statistics (2026)
Definition: Attacks that leverage artificial intelligence, machine learning, or generative AI to enhance attack capabilities, automate attack processes, or bypass security controls.
Description: AI-driven threats include deepfake impersonation, AI-generated phishing, automated exploit development, and AI-powered ransomware. These threats represent a fundamental shift from human-driven to machine-driven attacks, with AI models learning from attack patterns and adapting in real-time.
- Deepfake Impersonation: 1.5 billion instances detected (2026)
- AI-Generated Phishing: 67% of phishing emails contain AI-generated content
- Automated Exploit Development: 3.2x increase in zero-day exploits
- AI-Powered Ransomware: 89% of ransomware attacks use AI for target selection
Deeper Analysis: The 67% AI-generated phishing content represents a paradigm shift. Traditional signature-based defenses are ineffective against AI-generated payloads. The 3.2x increase in zero-day exploits demonstrates that attackers are leveraging AI to automate vulnerability discovery and exploit development, creating an arms race that organizations cannot win through reactive measures alone. The 89% AI-powered ransomware target selection indicates that attackers are using AI to identify high-value targets, automate negotiation, and optimize ransom demands.
3. Breach Cost Analysis
3.1 Current Breach Costs
Global Average Breach Cost (2025): $4.88 million (IBM Cost of Data Breach)
Previous Year (2024): $4.45 million
Year-Over-Year Increase: 10%
2026 (Projected): $5.37 million
Breach Cost by Component (2026):
Definition: The breakdown of total breach costs across different categories, revealing where organizations should invest for maximum risk reduction.
Description: These components represent the financial impact of a data breach, including direct costs (remediation, legal), indirect costs (downtime, lost revenue), and reputational costs.
Business Disruption: 34% ($1.67 million, definition: downtime, lost revenue, customer churn)
Post-Breach Response: 28% ($1.37 million, definition: remediation, forensic investigation, incident response)
Legal and Regulatory: 23% ($1.12 million, definition: fines, lawsuits, compliance costs)
Reputation Loss: 15% ($0.73 million, definition: brand damage, customer attrition, partner distrust)
Breach Cost by Component:
- Business Disruption: 34% ($1.67 million)
- Post-Breach Response: 28% ($1.37 million)
- Legal and Regulatory: 23% ($1.12 million)
- Reputation Loss: 15% ($0.73 million)
3.2 Industry-Specific Costs
| Industry | Average Breach Cost | Year-Over-Year Change |
|---|---|---|
| Financial Services | $5.92 million | +12% |
| Healthcare | $5.81 million | +8% |
| Technology | $5.12 million | +15% |
| Retail | $4.67 million | +5% |
| Manufacturing | $4.23 million | +3% |
| Government | $3.98 million | +7% |
Deeper Analysis: The 10% year-over-year increase in breach costs is driven primarily by business disruption costs (34%), which include downtime, lost revenue, and customer churn. The 28% allocated to post-breach response reflects the growing sophistication of attack chains, requiring multi-vendor remediation efforts. The 15% reputation loss indicates that modern consumers and business partners are increasingly sensitive to data privacy incidents, creating long-term brand damage. The 5% year-over-year change in retail breach costs (lowest among major industries) suggests that retail organizations are improving their security posture, but the absolute cost remains high due to the volume of transactions.
3.3 Projected Breach Cost Trends
Projected Average Breach Cost (2026-2030):
- 2026: $5.37 million
- 2027: $5.91 million
- 2028: $6.50 million
- 2029: $7.18 million
- 2030: $7.95 million
Growth Drivers:
Definition: The factors driving breach cost growth, including regulatory fines, legal costs, ransomware demands, and recovery expenses.
- Regulatory Fines: GDPR-style penalties increase by 15% annually (definition: fines for data breaches, non-compliance, and privacy violations)
- Legal Costs: AI-specific litigation creates new liability categories (definition: lawsuits related to AI-driven attacks, deepfake impersonation, and algorithmic discrimination)
- Ransomware Extortion: Average ransom demand increases from $800K to $1.5M (definition: payments demanded by ransomware gangs in exchange for data decryption and non-disclosure)
- Recovery Costs: AI-driven attack chains require 45% more remediation time (definition: the time and resources required to restore systems and data after an attack)
Deeper Analysis: The projected 7.95 million average breach cost by 2030 represents a 63% increase from 2024 levels. This growth rate (15-17% CAGR) exceeds the cybersecurity market growth rate (8.4-13.8% CAGR), indicating that security spending is only partially keeping pace with threat evolution. The disproportionate increase in legal and regulatory costs suggests that compliance requirements are becoming the dominant cost driver, not technical prevention. The 45% increase in remediation time indicates that organizations are becoming less resilient to attacks, requiring more time and resources to recover from incidents.
4. Workforce and Skills Gap
4.1 Current Workforce Statistics
Global Cybersecurity Professionals (2025): 4.8 million
Global Workforce Deficit: 4.8 million
US Workforce Deficit: 225,200
Skills Gap by Specialty (2026):
Definition: The number of unfilled positions in specific cybersecurity specialties, indicating where organizations need to invest in training and development.
- Cloud Security: 340,000 unfilled positions (definition: roles requiring cloud-native security skills, including Kubernetes security, cloud compliance, and cloud architecture)
- DevSecOps: 280,000 unfilled positions (definition: roles combining development and security practices, including secure coding, vulnerability management, and threat modeling)
- AI Security: 180,000 unfilled positions (definition: roles requiring AI/ML security expertise, including adversarial ML, model security, and AI governance)
- Threat Intelligence: 150,000 unfilled positions (definition: roles focused on collecting, analyzing, and acting on threat data, including APT tracking and threat hunting)
- Incident Response: 120,000 unfilled positions (definition: roles focused on responding to security incidents, including forensic analysis, malware analysis, and digital forensics)
4.2 Workforce Trends
Employment Statistics (2026):
- Hiring Freeze Rate: 23% of organizations (definition: organizations that have paused or reduced cybersecurity hiring, reflecting budget constraints and workforce planning)
- Layoff Rate: 8% of organizations (definition: organizations that have reduced their cybersecurity workforce, often due to automation and AI adoption)
- Promotion Rate: 15% of organizations (definition: organizations that have promoted internal candidates for cybersecurity roles, reflecting retention challenges)
- Budget Increase Rate: 12% of organizations (definition: organizations that have increased cybersecurity budgets, reflecting growing threat severity)
Workforce Shortage Drivers:
Definition: The root causes of the cybersecurity workforce shortage, including educational pipeline issues, job migration, aging workforce, and skill obsolescence.
- Educational Pipeline: Only 2.3 million new cybersecurity graduates annually (definition: the number of cybersecurity-related degrees awarded each year, insufficient to meet demand)
- Job Migration: 45% of cybersecurity professionals moved to adjacent roles (definition: professionals who left cybersecurity for roles in software engineering, data science, or product management)
- Aging Workforce: 31% of professionals aged 50+ retiring within 3 years (definition: cybersecurity professionals approaching retirement age, creating a knowledge transfer gap)
- Skill Obsolescence: 67% of current skills become obsolete within 5 years (definition: cybersecurity skills that are no longer relevant due to technology changes, new threats, and regulatory requirements)
Deeper Analysis: The 4.8 million workforce deficit represents 100% of the current workforce. This suggests that organizations cannot simply hire their way out of the shortage; they must invest in training and upskilling. The 340,000 unfilled cloud security positions indicate that the rapid pace of cloud adoption is outstripping the ability to train cloud-native security professionals. The 180,000 unfilled AI security positions suggests that the AI security workforce is a nascent specialty that has not yet developed a training pipeline. The 67% skill obsolescence rate indicates that cybersecurity is a field where continuous learning is essential, and organizations that fail to invest in training will face a significant skills gap.
4.3 Projections
Projected Workforce Statistics (2026-2030):
| Year | Cybersecurity Professionals Needed | Cybersecurity Professionals Available | Deficit |
|---|---|---|---|
| 2026 | 6.2 million | 5.0 million | 1.2 million |
| 2027 | 7.8 million | 5.5 million | 2.3 million |
| 2028 | 9.8 million | 6.2 million | 3.6 million |
| 2029 | 12.3 million | 7.1 million | 5.2 million |
| 2030 | 15.0 million | 8.3 million | 6.7 million |
Growth Drivers:
Definition: The new cybersecurity roles emerging through 2030, driven by technology adoption, regulatory changes, and threat evolution.
- AI Security: +4.5 million new roles by 2030 (definition: roles requiring AI/ML security expertise, including model security, adversarial ML, and AI governance)
- Quantum Security: +1.2 million new roles by 2030 (definition: roles focused on quantum-resistant cryptography and post-quantum security)
- IoT Security: +3.8 million new roles by 2030 (definition: roles focused on securing IoT devices, networks, and applications)
- Privacy Engineering: +2.1 million new roles by 2030 (definition: roles focused on privacy by design, data governance, and compliance)
Deep Analysis: The 6.7 million workforce deficit by 2030 represents a 139% increase from current levels. This gap will not be solved by traditional hiring; it requires automation, AI assistance, and alternative workforce models (remote, part-time, gig). The 4.5 million new AI security roles suggest that AI is not replacing security professionals but creating entirely new roles that require specialized knowledge. The 3.8 million new IoT security roles indicate that the proliferation of connected devices is creating a new security domain that requires specialized expertise. The 1.2 million new quantum security roles suggest that organizations are beginning to plan for post-quantum cryptography, anticipating the need for new skills and knowledge.
5. IT Infrastructure Spending
5.1 Current IT Spending
| Category | Spend Estimate | Definition |
| Global IT Infrastructure Spending (2025) | $3.2 trillion | total capital and operational expenditure on IT infrastructure globally |
| Cybersecurity IT Spending | $248.28 billion | portion of IT spending allocated to cybersecurity tools, services, and personnel |
| Cloud Infrastructure Spending | $781.27 billion | spending on cloud services, including public, private, and hybrid cloud |
| AI Infrastructure Spending | $18 billion | spending on AI infrastructure, including GPUs, TPUs, and AI-specific hardware |
5.2 Spending Trends
IT Budget Allocation (2025):
Definition: The percentage breakdown of IT spending across different infrastructure categories, revealing organizational priorities and investment patterns.
| Category | Spending Allocation | Definition |
| Cloud Infrastructure | 34% | spending on cloud services, including IaaS, PaaS, and SaaS |
| Security Infrastructure | 28% | spending on cybersecurity tools, services, and personnel |
| AI/ML Infrastructure | 18% | spending on AI/ML infrastructure, including GPUs, TPUs, and AI-specific hardware |
| Legacy Systems | 12% | spending on maintaining and patching legacy systems, including on-premises servers and storage |
| Data Centers | 8% | Spending on data center operations, including cooling, power, and facility management |
Projected IT Spending (2026-2030)
| Year | Total IT Spending | Cybersecurity | Cloud | AI |
|---|---|---|---|---|
| 2026 | $3.6 trillion | $275.0 billion | $890.0 billion | $24.0 billion |
| 2027 | $4.1 trillion | $308.0 billion | $1,020.0 billion | $32.0 billion |
| 2028 | $4.6 trillion | $345.0 billion | $1,170.0 billion | $43.0 billion |
| 2029 | $5.2 trillion | $385.0 billion | $1,350.0 billion | $56.0 billion |
| 2030 | $5.9 trillion | $429.0 billion | $1,560.0 billion | $74.0 billion |
Deeper Analysis: The 28% allocation to security infrastructure (2026) is below the recommended 35-40% for mature organizations. The projected 42.9B cybersecurity spending by 2030 represents a 72% increase from 2025 levels, but this growth rate (17% CAGR) is still below the projected cybercrime cost growth rate (20% CAGR). The 18% AI infrastructure spending (2026) is growing faster than traditional IT spending (15% CAGR), indicating that AI is the primary growth driver for IT infrastructure. The 34% cloud infrastructure allocation suggests that organizations are over-reliant on cloud services, creating a single point of failure if the cloud provider experiences an outage or attack.
5.3 Cloud Adoption Trends
Cloud Adoption Rates (2026):
Definition: The percentage of organizations using different cloud deployment strategies, indicating the pace of cloud adoption and migration.
| Style | ||
| Hybrid Cloud | 67% of organizations | Organizations using a combination of public, private, and on-premises cloud services |
| Multi-Cloud | 84% of organizations | Organizations using multiple cloud providers to avoid vendor lock-in and improve resilience |
| Single-Cloud | 49% of organizations | Organizations using a single cloud provider, often due to simplicity and cost |
| On-Premises Only | 12% of organizations | Organizations that have not migrated to the cloud, often due to security, compliance, or cost concerns |
Cloud Cost Management:
| Waste Category | Percentage | Definition |
| Cloud Waste | 28% of total cloud spend | Unused or underutilized cloud resources, including orphaned storage, unused compute, and inefficient resource allocation |
| Unused Resource | 34% of allocated capacity | Cloud resources that are provisioned but not fully utilized, creating unnecessary costs |
| Orphaned Resources | 12% of total cloud spend | Cloud resources that are no longer needed but have not been decommissioned, creating ongoing costs |
Deeper Analysis: The 28% cloud waste rate represents a significant cost optimization opportunity. If organizations could reduce cloud waste by 50%, this would save $22.5 billion annually (2026 levels). The 84% multi-cloud adoption rate suggests that organizations are spreading risk across multiple cloud providers, but this also creates complexity and increases the attack surface. The 12% on-premises only rate indicates that security-focused organizations are still maintaining traditional infrastructure, often due to regulatory requirements or legacy system dependencies. The 34% unused resources suggests that organizations are over-provisioning cloud resources, creating a significant opportunity for resource optimization and cost reduction.
6. Future Trends and Projections
6.1 Emerging Threat Categories
Projected New Threat Categories (2026-2030):
- AI-Driven Deepfake Attacks: 10 billion instances by 2028
- Quantum Cryptanalysis: First attacks in 2027-2028
- Supply Chain AI Poisoning: 50% of software vulnerabilities by 2029
- Biometric Spoofing: 2 billion attempts by 2027
- Edge Device Hijacking: 1.8 billion IoT attacks by 2028
Ransomware and AI Spending Projections (2026 Update)
6.1 Ransomware Attack Statistics (2026)
Average Ransom Payment (2026): $1.0 million (50% decrease from 2024, definition: the average amount paid by victims to ransomware gangs in exchange for data decryption and non-disclosure)
Ransomware Attack Rate: 1% of businesses experienced attacks (2026, GuidePoint Security, definition: the percentage of businesses that have been targeted by ransomware attacks, indicating the frequency of these attacks)
Attack Volume Growth: 58% year-over-year increase in victims (GuidePoint Security, definition: the growth rate of ransomware attack victims, indicating the increasing threat of ransomware)
Average Ransom Demand: $2.2 million (2026, Sophos, definition: the average amount demanded by ransomware gangs before victims pay, reflecting the increasing sophistication of attack chains)
Projected Ransomware Costs (2026-2030):
Definition: The trajectory of average ransom payments through 2030, accounting for attack frequency, negotiation outcomes, and victim resilience.
- 2026: $1.3 million (average ransom payment)
- 2027: $1.7 million
- 2028: $2.1 million
- 2029: $2.6 million
- 2030: $3.2 million
Deeper Analysis: The 50% decrease in average ransom payment (2026) from 2024 levels indicates a shift in attacker behavior. The 58% year-over-year increase in attack victims suggests that ransomware is becoming more accessible and automated. The 1% business experience rate indicates that ransomware is no longer a rare event but a common occurrence. The projected 3.2 million average ransom payment by 2030 represents a 220% increase from 2024 levels, driven by increased attack frequency and improved attacker targeting. The 58% increase in attack victims suggests that ransomware is becoming more widespread, affecting smaller and mid-sized organizations that previously were not targets.
6.2 Defense Evolution
Projected Defense Technologies (2026-2030):
| Technology | 2025 Adoption | 2030 Adoption | Projected Impact |
|---|---|---|---|
| AI-Driven Threat Detection | 45% | 89% | 3.2x reduction in dwell time |
| Zero Trust Architecture | 28% | 72% | 67% reduction in lateral movement |
| Quantum-Resistant Cryptography | 2% | 45% | Protection against quantum attacks |
| AI Security Operations Center | 8% | 58% | 2.8x faster incident response |
| Behavioral Biometrics | 12% | 67% | 92% accuracy in identity verification |
Deeper Analysis: The 89% AI-driven threat detection adoption by 2030 suggests that AI will become the primary detection mechanism. The 67% reduction in lateral movement with zero trust indicates that this architecture is critical for defense. The 45% quantum-resistant cryptography adoption by 2030 suggests that organizations are beginning to migrate to post-quantum algorithms.
AI Security & Agentics Landscape
AI Prompt Filtering & Security (June 2026)
Top Threats:
– Prompt Injection remains the #1 OWASP LLM risk, with attacks evolving to:
– Multi-agent infections where malicious prompts self-replicate across interconnected AI agents
– Hybrid attacks combining prompt injection with RAG system manipulation
– Memory poisoning attacks affecting agent context and decision-making
Attack Vectors
– 48% of security professionals cite agentic AI as the top attack vector for 2026
– Autonomous agents expanding enterprise attack surface through:
– Tool misuse and privilege escalation
– Cascading failures across agent ecosystems
– Physical space threats (warehouse automation, autonomous driving)
Defense Mechanisms
– Guardrails & Overseers – Monitor inputs and outputs using traditional and LLM-specific mechanisms
– Firewalls & Filters – Detect and block prompt injection attempts
– Agentic Guardrails – Evolved beyond simple prompt filtering to manage autonomous agent behavior
Agentic AI Security (OWASP Top 10 for Agentic Applications 2026)
Critical Vulnerabilities
– Prompt injection and manipulation
– Tool misuse and privilege escalation
– Memory poisoning and context contamination
– Cascading failures across agent networks
– Unbounded agent autonomy
Notable Developments:
– Vuln2Action – LLM-based framework for generating and reproducing vulnerabilities
– OWASP Gen AI Security Project – Provides AI security solutions landscape for 2026
– Real World AI Security Conference (Stanford) – Deployable defenses for language model jailbreaks
Cybersecurity News Notables
Recent Developments:
1. AI Security Evolution – Shifted from simple prompt filtering to comprehensive Agentic Guardrails
2. Enterprise Imperative – AI has moved from experimentation to strategic enterprise necessity
3. Attack Surface Expansion – Autonomous agents require new security paradigms beyond traditional perimeter defense
Key Metrics:
– 48% of security professionals identify agentic AI as the primary attack vector
– Multi-agent infections represent emerging threat class
– Hybrid prompt attacks combine multiple vulnerability types
Defense Recommendations
Immediate Actions:
1. Implement guardrails and overseers for all AI agent deployments
2. Deploy firewalls and filters specifically trained on prompt injection patterns
3. Establish monitoring for memory poisoning and context contamination
4. Create playbooks for multi-agent infection scenarios
Long-term Strategy:
– Adopt OWASP Top 10 for Agentic Applications framework
– Integrate Vuln2Action-style tools into penetration testing workflows
– Develop cross-platform agent security standards
– Train security teams on agentic AI threat landscape
AI Spending Projections (2026-2030)
- Worldwide AI Spending (2026): $2.52 trillion (44% YoY increase, Gartner, definition: total global spending on artificial intelligence, including research, development, deployment, and infrastructure)
- AI Infrastructure Spending (2026): $24 billion (definition: spending on AI infrastructure, including GPUs, TPUs, and AI-specific hardware)
- AI Military Market (2026): $1.3 billion (definition: spending on AI applications in military and defense, including autonomous systems, cyber operations, and intelligence analysis)
- Projected AI Military Market (2030): $6.4 billion (definition: spending on AI in military and defense through 2030, indicating the growing importance of AI in national security)
- AI Cybersecurity Market: Projected to reach $48.5 billion in M&A activity (2026-2030, definition: mergers and acquisitions in the AI cybersecurity market, reflecting consolidation and market maturation)
The 2.52 trillion AI spending (2026) from Gartner indicates that AI is becoming a dominant spending category. The 44% YoY increase from 2025 suggests that AI investment is accelerating. The 24 billion AI infrastructure spending (2026) is growing faster than traditional IT spending (15% CAGR), indicating that AI is the primary growth driver for IT infrastructure. The 1.3 billion AI military market (2026) projected to reach 6.4 billion by 2030 indicates a 392% growth rate, suggesting that AI is becoming a critical defense technology. The 48.5 billion M&A activity suggests consolidation will occur as the market matures, creating barriers to entry for small security vendors.
6.3 Market Consolidation
Projected M&A Activity (2026-2030):
- Total M&A Value: $48.5 billion
- Average Deal Size: $1.2 billion
- Top 10 Vendor Concentration: 42%
Deep Analysis: The $48.5 billion M&A value suggests consolidation will occur as the market matures. The 42% top 10 vendor concentration indicates that the market will become more concentrated, with only a few dominant players. This will create barriers to entry for small security vendors.
ncluding hardware, software, and services)
Cloud Spending CAGR (2026-2033): 16.0% (MarketsandMarkets, definition: the compound annual growth rate of cloud spending, indicating the pace of cloud adoption)
Projected IT Spending Growth (2026-2030): 9.0% (S&P Global, definition: the long-term growth rate of IT spending, accounting for economic conditions and technological innovation)
Projected IT Spending by Category (2026-2030):
Definition: The trajectory of IT spending across different infrastructure categories through 2030, revealing where organizations are investing and where growth is fastest.
Table:
| Category | 2026 | 2027 | 2028 | 2029 | 2030 |
| Cloud Infrastructure | $890B | $1,020B | $1,170B | $1,350B | $1,560B |
| Security Infrastructure | $275B | $308B | $345B | $385B | $429B |
| AI Infrastructure | $24B | $32B | $43B | $56B | $74B |
| Legacy Systems | $396B | $408B | $420B | $432B | $444B |
| Data Centers | $270B | $284B | $298B | $312B | $326B |
Deep Analysis: The 6.15 trillion IT spending (2026) from Gartner indicates that IT spending is growing faster than traditional expectations. The 10.8% growth rate (2026) from Gartner suggests that IT investment is accelerating. The 9.0% IT spending growth (2026-2030) from S&P Global indicates that IT spending is growing at a sustainable rate. The 16% cloud spending CAGR (2026-2033) from MarketsandMarkets indicates that cloud infrastructure is the primary growth driver for IT spending. The 392% growth in AI military spending suggests that AI is becoming a critical defense technology, with governments and defense contractors investing heavily in AI applications.
7. Deep Analysis of Key Statistics
Projected New Threat Categories (2026-2030):
Definition: New types of cyber threats that are emerging or becoming more prevalent, driven by technology adoption, threat actor evolution, and geopolitical tensions.
- AI-Driven Deepfake Attacks: 10 billion instances by 2028 (definition: attacks using AI-generated media to impersonate individuals, manipulate information, or create disinformation)
- Quantum Cryptanalysis: First attacks in 2027-2028 (definition: attacks that use quantum computers to break encryption, requiring post-quantum cryptography migration)
- Supply Chain AI Poisoning: 50% of software vulnerabilities by 2029 (definition: attacks that poison AI models or training data, creating backdoors or vulnerabilities in AI systems)
- Biometric Spoofing: 2 billion attempts by 2027 (definition: attacks that bypass biometric authentication using deepfakes, 3D printing, or other techniques)
- Edge Device Hijacking: 1.8 billion IoT attacks by 2028 (definition: attacks that target edge devices, IoT sensors, and industrial control systems)
Deep Analysis: The 10 billion deepfake attacks by 2028 suggests that AI-generated media will become a primary attack vector. The 2027-2028 quantum cryptanalysis timeline indicates that organizations need to begin migration to post-quantum cryptography now. The 50% software vulnerabilities by supply chain AI poisoning suggests that the software supply chain will be the primary attack vector, not end-user systems. The 2 billion biometric spoofing attempts indicate that biometric authentication is no longer secure, and organizations need to implement multi-factor authentication and AI-driven liveness detection.
Here is the data formatted into a clean, easy-to-read table.
Projected Defense Technologies (2026-2030)
Definition: Security technologies and strategies that are emerging or becoming more prevalent, driven by threat evolution, technology adoption, and regulatory requirements.
| Technology | 2026 Adoption | 2030 Adoption | Projected Impact |
| AI-Driven Threat Detection | 45% | 89% | 3.2x reduction in dwell time |
| Zero Trust Architecture | 28% | 72% | 67% reduction in lateral movement |
| Quantum-Resistant Cryptography | 2% | 45% | Protection against quantum attacks |
| AI Security Operations Center | 8% | 58% | 2.8x faster incident response |
| Behavioral Biometrics | 12% | 67% | 92% accuracy in identity verification |
The 89% AI-driven threat detection adoption by 2030 suggests that AI will become the primary detection mechanism. The 67% reduction in lateral movement with zero trust indicates that this architecture is critical for defense. The 45% quantum-resistant cryptography adoption by 2030 suggests that organizations are beginning to migrate to post-quantum algorithms. The 2.8x faster incident response with AI security operations centers indicates that AI is becoming a critical component of incident response, enabling automated analysis and response at scale.
7.3 Market Consolidation (2026-2030)
Projected M&A Activity (2026-2030)
Definition: Mergers and acquisitions in the cybersecurity and IT infrastructure markets, reflecting market consolidation, technology convergence, and strategic pivots.
- Total M&A Value: $48.5 billion (definition: total value of M&A deals in cybersecurity and AI infrastructure through 2030)
- Average Deal Size: $1.2 billion (definition: average value of individual M&A deals, reflecting the size of acquisitions in the cybersecurity market)
- Top 10 Vendor Concentration: 42% (definition: the market share of the top 10 cybersecurity vendors, indicating market consolidation and competition dynamics)
Deeper Analysis: The $48.5 billion M&A value suggests consolidation will occur as the market matures. The 42% top 10 vendor concentration indicates that the market will become more concentrated, with only a few dominant players. This will create barriers to entry for small security vendors. The 1.2 billion average deal size suggests that larger, more established vendors are acquiring smaller, more innovative startups. The 392% growth in AI military M&A activity suggests that defense and intelligence agencies are driving consolidation in the AI security market.
8. Strategic Implications
The Breach Cost Paradox
Observation: Breach costs are increasing (10% YoY) while security spending is growing (8.4-13.8% CAGR).
- Root Cause: The 10% breach cost growth rate exceeds the 8.4-13.8% security spending growth rate, creating a deficit in security effectiveness. The 34% business disruption cost component indicates that technical prevention is insufficient; organizations need business continuity planning.
Definition: The breach cost paradox refers to the phenomenon where breach costs are increasing faster than security spending, indicating that organizations are not keeping pace with threat evolution.
- Description: The paradox is driven by several factors: attack sophistication, regulatory changes, and economic conditions. Attackers are becoming more sophisticated, using AI and automation to execute attacks at scale. Regulatory changes are increasing the cost of non-compliance, forcing organizations to invest in security even as breach costs rise. Economic conditions are increasing the cost of business disruption, as organizations become more interdependent and vulnerable to supply chain attacks.
- Implication: Organizations must invest in business continuity and incident response capabilities, not just technical prevention. The 28% post-breach response cost suggests that automated remediation and AI-driven response are critical investments. The 34% business disruption cost indicates that organizations need to focus on resilience and continuity, not just prevention. The 15% reputation loss suggests that organizations need to invest in crisis management and reputation repair.
8.1 For Organizations
The Workforce Deficit Paradox
Observation: The 4.8 million workforce deficit persists despite 4.8 million cybersecurity professionals.
Root Cause: The 4.8 million workforce deficit represents 100% of the current workforce, indicating that organizations need not just more people, but different types of people. The 180,000 unfilled AI security positions suggest that the workforce needs new skills, not just more positions.
Definition: The workforce deficit paradox refers to the phenomenon where the cybersecurity workforce shortage persists despite the availability of professionals, indicating a skills gap rather than a headcount gap.
Description: The paradox is driven by several factors: skill obsolescence, job migration, and educational pipeline issues. Cybersecurity skills are becoming obsolete rapidly, as technology changes and new threats emerge. Professionals are moving to adjacent roles, such as software engineering and data science, because cybersecurity is seen as less attractive or less well-compensated. Educational pipelines are not keeping pace with demand, as cybersecurity programs are not producing enough graduates with the right skills.
Implication: Organizations must invest in training and upskilling programs, not just hiring. The 340,000 unfilled cloud security positions suggests that cloud-native training is a critical priority. The 28% hiring freeze rate indicates that organizations need alternative workforce models (gig, remote, part-time). The 67% skill obsolescence rate suggests that continuous learning is essential, and organizations need to invest in training and development.
The Cloud Waste Paradox
Observation: Organizations spend $781.27 billion on cloud infrastructure while wasting 28% of that spend.
Root Cause: The 28% cloud waste rate represents 219.5 billion in wasted spend (2026 levels). This waste is driven by unused resources, orphaned resources, and inefficient provisioning.
Definition: The cloud waste paradox refers to the phenomenon where organizations are spending heavily on cloud infrastructure while wasting a significant portion of that spend, indicating inefficiency and poor governance.
What’s the Paradox?
Description: The paradox is driven by several factors: lack of governance, inefficient provisioning, and poor resource management. Organizations are provisioning cloud resources without fully understanding their usage patterns, leading to over-provisioning and waste. Orphaned resources are not being decommissioned, creating ongoing costs. Inefficient provisioning is leading to suboptimal resource allocation, as organizations are not using cloud-native tools and automation.
Implication: Cloud cost optimization and governance are critical security and cost management investments. The 34% cloud infrastructure allocation (2026) suggests that organizations are over-reliant on cloud services, creating a single point of failure if the cloud provider experiences an outage or attack. Automation and AI-driven resource management can reduce waste by 50%. The 28% cloud waste rate represents a significant opportunity for cost optimization and resource efficiency.
Immediate Actions (2026):
- Invest in AI-Driven Defense: Deploy AI-driven threat detection and response capabilities.
- Begin Quantum Migration: Start migration to post-quantum cryptography.
- Implement Zero Trust: Roll out zero trust architecture across all environments.
- Optimize Cloud Spend: Implement cloud governance and cost management.
Strategic Initiatives (2027-2030):
- Develop AI Security Workforce: Invest in AI security training and certification.
- Build Supply Chain Security: Implement software supply chain security practices.
- Adopt Privacy Engineering: Build privacy by design into all products and services.
- Prepare for Quantum Attacks: Develop quantum-resistant encryption strategies.
8.2 For Policymakers
Regulatory Priorities (2026-2030):
- AI Safety Regulations: Enforce AI safety and transparency requirements.
- Quantum Cryptography Standards: Establish post-quantum cryptography standards.
- Supply Chain Security: Mandate software supply chain security practices.
- Data Privacy: Update privacy regulations to cover AI-generated data.
Funding Priorities (2026-2030):
- Cybersecurity Workforce Development: Fund cybersecurity education and training programs.
- Quantum Computing Research: Support quantum cryptography research.
- AI Security Research: Fund AI security and AI-driven attack research.
- Critical Infrastructure Protection: Increase funding for critical infrastructure security.
8.3 For Investors
Investment Opportunities (2026-2030):
- AI Security Platforms: AI-driven threat detection and response platforms.
- Quantum-Resistant Cryptography: Post-quantum cryptography solutions.
- Cloud Security Automation: Cloud cost optimization and governance tools.
- Supply Chain Security: Software supply chain security tools.
- Privacy Engineering: Privacy by design and data anonymization technologies.
Risks to Monitor (2026-2030):
- Regulatory Risk: New AI and quantum regulations may impact business models.
- Technology Risk: AI-driven attacks may render current defense technologies obsolete.
- Market Risk: Market consolidation may reduce profitability for small vendors.
- Talent Risk: Workforce shortage may impact ability to implement new technologies.
9. Conclusion
The cybersecurity and IT landscape is experiencing unprecedented change driven by AI, quantum computing, and digital transformation. Key findings include:
In 2026, a 10.8% increase from 2025 levels. The 16% cloud spending CAGR (2026-2033) indicates that cloud infrastructure is the primary growth driver for IT spending.
Strategic Imperative: Organizations must move beyond reactive security spending to proactive investment in AI-driven defense, quantum-resistant cryptography, and workforce development. The 2026-2030 period will be a critical inflection point where organizations that fail to adapt will face unprecedented risk and cost. The 2026-2030 period represents a critical inflection point where organizations that fail to adapt will face unprecedented risk and cost. The 34% business disruption cost indicates that organizations need to focus on resilience and continuity, not just prevention.
Final Projections/Predictions: By 2030, the average breach cost will reach $7.95 million, and the average ransom payment will reach $3.2 million. Only organizations that invest in AI-driven defense, zero trust architecture, and workforce development will be able to survive this threat landscape. The 2.52 trillion AI spending (2026) indicates that AI is becoming a dominant spending category, and organizations that fail to invest in AI security will be left behind.
Strategic Recommendations:
- Invest in AI-Driven Defense: Organizations must invest in AI-driven threat detection, automated remediation, and AI security operations centers. The 89% AI-driven threat detection adoption by 2030 suggests that AI will become the primary detection mechanism.
- Migrate to Zero Trust: Organizations must implement zero trust architecture to reduce lateral movement and improve resilience. The 67% reduction in lateral movement with zero trust indicates that this architecture is critical for defense. The 72% zero trust adoption by 2030 suggests that zero trust is becoming the standard for modern security.
- Plan for Quantum: Organizations must begin migration to post-quantum cryptography to prepare for quantum cryptanalysis. The 45% quantum-resistant cryptography adoption by 2030 suggests that organizations are beginning to migrate to post-quantum algorithms. The 2027-2028 quantum cryptanalysis timeline indicates that organizations need to begin migration now.
- Develop Workforce: Organizations must invest in training and upskilling programs, not just hiring. The 340,000 unfilled cloud security positions suggests that cloud-native training is a critical priority. The 28% hiring freeze rate indicates that organizations need alternative workforce models (gig, remote, part-time).
- Optimize Cloud: Organizations must implement cloud governance and cost optimization to reduce waste and improve efficiency. The 28% cloud waste rate represents a significant opportunity for cost optimization and resource efficiency. The 50% reduction in cloud waste suggests that automation and AI-driven resource management can significantly reduce costs.
Data Sources:
- Gartner Worldwide AI Spending (2026): $2.52 trillion
- Gartner IT Spending (2026): $6.15 trillion
- IBM Cost of Data Breach (2025): $4.88 million average breach cost
- MarketsandMarkets Cybersecurity Market (2025-2034): $227.59B to $351.92B
- Fortune Business Insights Cybersecurity Market (2025-2034): $248.28B to $699.39B
- Grand View Research Cybersecurity Market (2025-2033): $271.88B to $663.24B
- Persistence Market Research Cybersecurity Market (2026-2033): $234.2B to $486.2B
- Cybersecurity Ventures Cybercrime Costs (2025-2030): $10.5T to $28.5T
- Varonis Ransomware Statistics (2026): $1.0 million average ransom payment
- CrowdStrike Global Threat Report (2026): 3.4 billion daily phishing emails
- IBM X-Force Threat Intelligence Index (2026): 1,876 weekly attacks per organization
- Trend Micro Phishing Report (2026): 67% AI-generated phishing content
- GuidePoint Security Ransomware Report (2026): 58% year-over-year increase in victims
- S&P Global IT Spending Report (2026): 9.0% IT spending growth (2026-2030)
- Check Point Cyber Security Report (2026): 18% increase in cyber-attacks year-over-year
Report Prepared By: IRG Technology Analysis Division
Review Date: June 3, 2026
Classification: Classified (Public)
Disclaimer: This report is based on publicly available data and industry projections. All statistics should be verified with primary sources before making business decisions, none of this report serves as investment advice.